Lead time vs cycle time: what's the difference?

Both measure how long work takes. But they answer different questions — and confusing them leads to wrong conclusions about your team.

In a nutshell

The short version

Cycle time runs from the moment someone starts working on a ticket to the moment it's done. It tells you how fast your team moves once they pick something up.

Lead time runs from the moment the request enters the system — a PO writes the story, a customer files the ticket, it lands in the backlog — to the same "done" point. It tells you how long the person who asked has been waiting.

The gap between the two is queue time. If lead time is much longer than cycle time, most of the wait happens before anyone starts working. That's not a speed problem, it's a backlog or prioritisation problem.

Why the difference matters

If cycle time looks good but lead time doesn't, your team is working fast — but requests are piling up before they get picked. Either the backlog is too full, priorities take too long to settle, or stakeholders are waiting on decisions upstream.

If both look bad, you have a flow problem. Too much work in progress, too many context switches, or blockers sitting on tickets. The team isn't slow; the system is clogged.

Measuring only one misses half the picture. Stakeholders care about lead time — that's the number they feel. Teams can actually influence cycle time directly. You need both to have the right conversations with the right people.

Measuring it

How to measure both in Jira

Jira has neither a lead time nor a cycle time field natively. Both come from the same raw material: the status transition history of each ticket. You need to decide which statuses mark each boundary for your workflow.

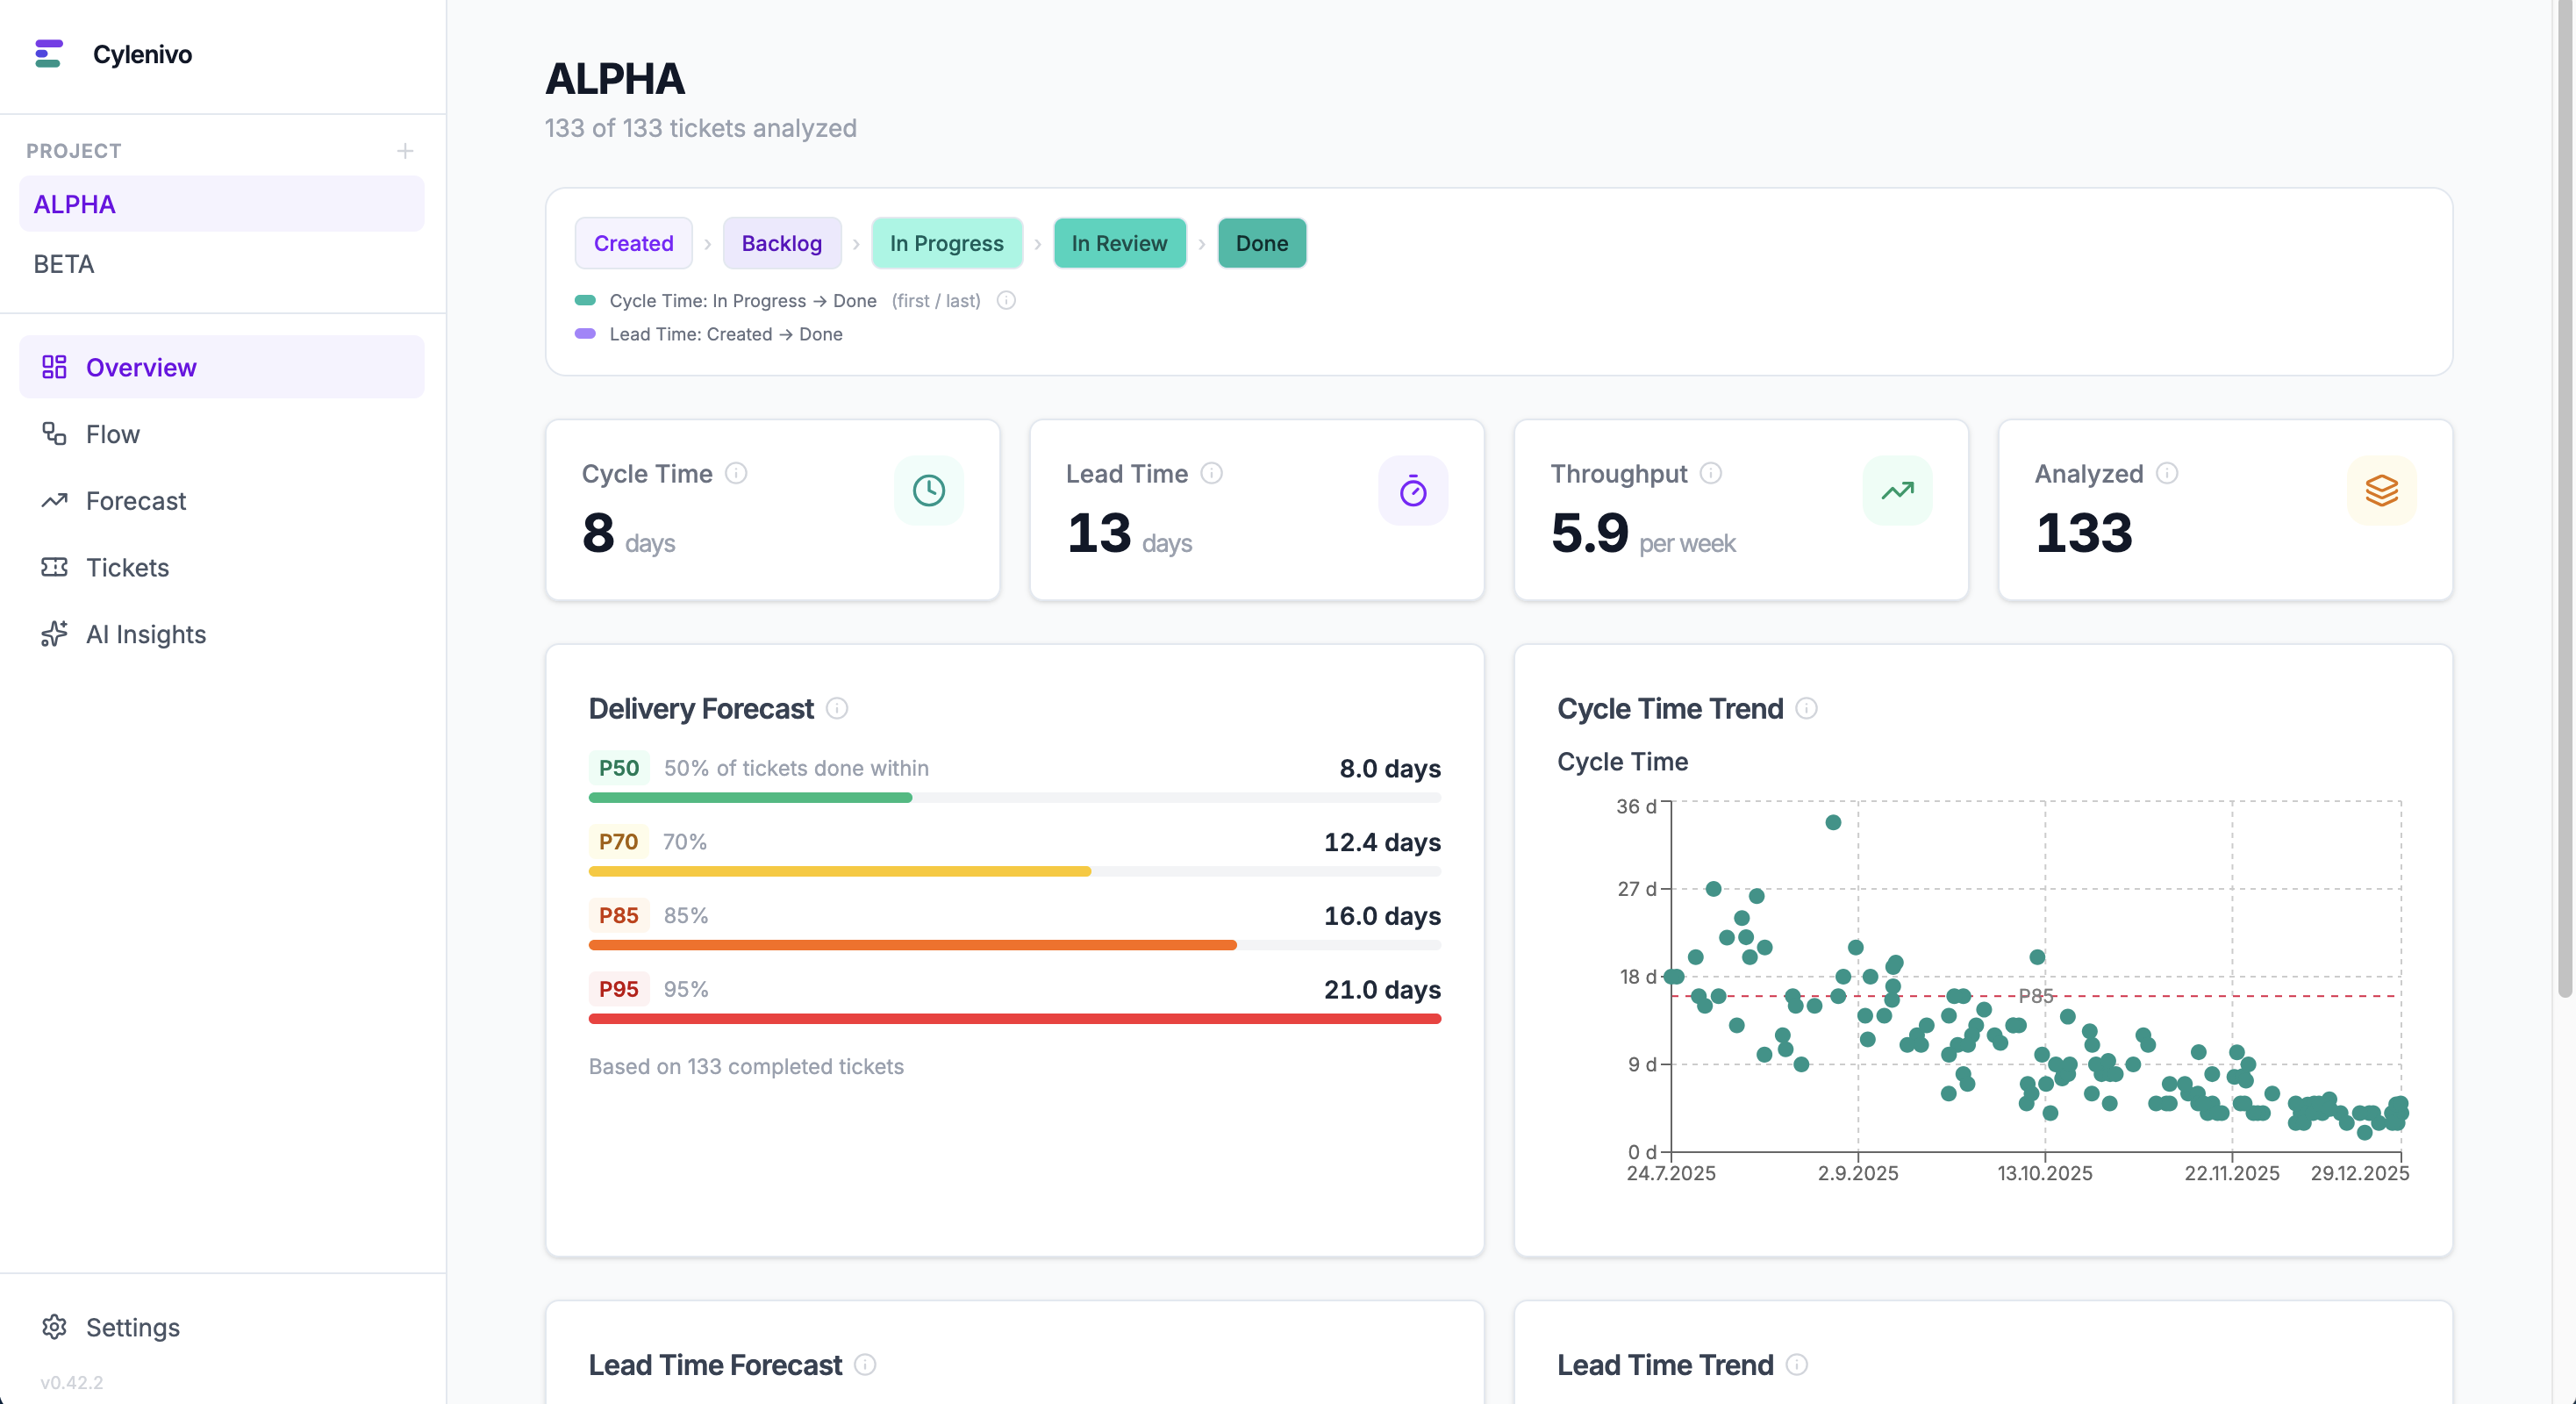
Cylenivo reads that history via the Jira API and lets you configure it explicitly. You pick which statuses count as lead time start (typically "Backlog" or "To Do") and which count as cycle time start (usually "In Progress" or "In Development"). The end point — "Done", "Closed", or whatever your team uses — is shared.

From there both metrics come out together: percentiles, distribution charts, trends over time. You can see the queue time directly as the gap between the two.

Cylenivo dashboard showing lead time and cycle time from Jira status transitions

Try it

See both lead time and cycle time from your Jira data — with percentiles, trends, and distribution charts.

Fetching latest release…

Keep reading

Further reading

How to measure cycle time in Jira

Jira doesn't show cycle time natively. Learn what it means and how to get real data.

Read the guide →

The physics behind flow

Little's Law, Kingman's formula, and why WIP limits aren't optional.

Explore Flow Physics →

The Work-Feedback Loop

A framework for turning metrics into actual change, not just reports.

Read about the WFL →