Jira tracks when a ticket moves between statuses. But it doesn't tell you how long work actually takes. Here's how to get real cycle time data from your Jira projects.
Cycle time is the elapsed time from the moment a team starts work on a ticket to the moment that ticket is done. Not when it was created, not when it was estimated — when someone actually picked it up and began.
It's easy to confuse with lead time, which is a different span: lead time starts when the request enters the system (a customer asks, a PO writes the story) and ends at the same "done" point. Lead time includes waiting in the backlog. Cycle time doesn't.
Both matter, but they answer different questions. Cycle time tells you how fast your team works once they start. Lead time tells you how long people wait for their request to ship.
Jira has no native cycle time field. The built-in Control Chart comes close, but it measures time tickets spend in columns on your board — not transitions between workflow statuses. If your board groups "In Progress" and "In Review" into one column, you lose that granularity.
Velocity charts don't help either. They measure story points completed per sprint, which is an estimation signal, not a duration. You can have high velocity and terrible cycle time at the same time.
The data you actually need is in the issue history: every status change, with a timestamp. Jira stores it — but it doesn't surface it as a metric. To get real cycle time, you have to pull that history out, pick which transitions count as "start" and "end" for your workflow, and compute the distribution yourself.
Cylenivo connects to your Jira instance, reads the full status transition history for every ticket via the Jira API, and builds the timeline itself. You tell it which statuses mark the start of work (e.g. "In Progress") and which mark the end ("Done", "Closed"). Cylenivo handles the rest.
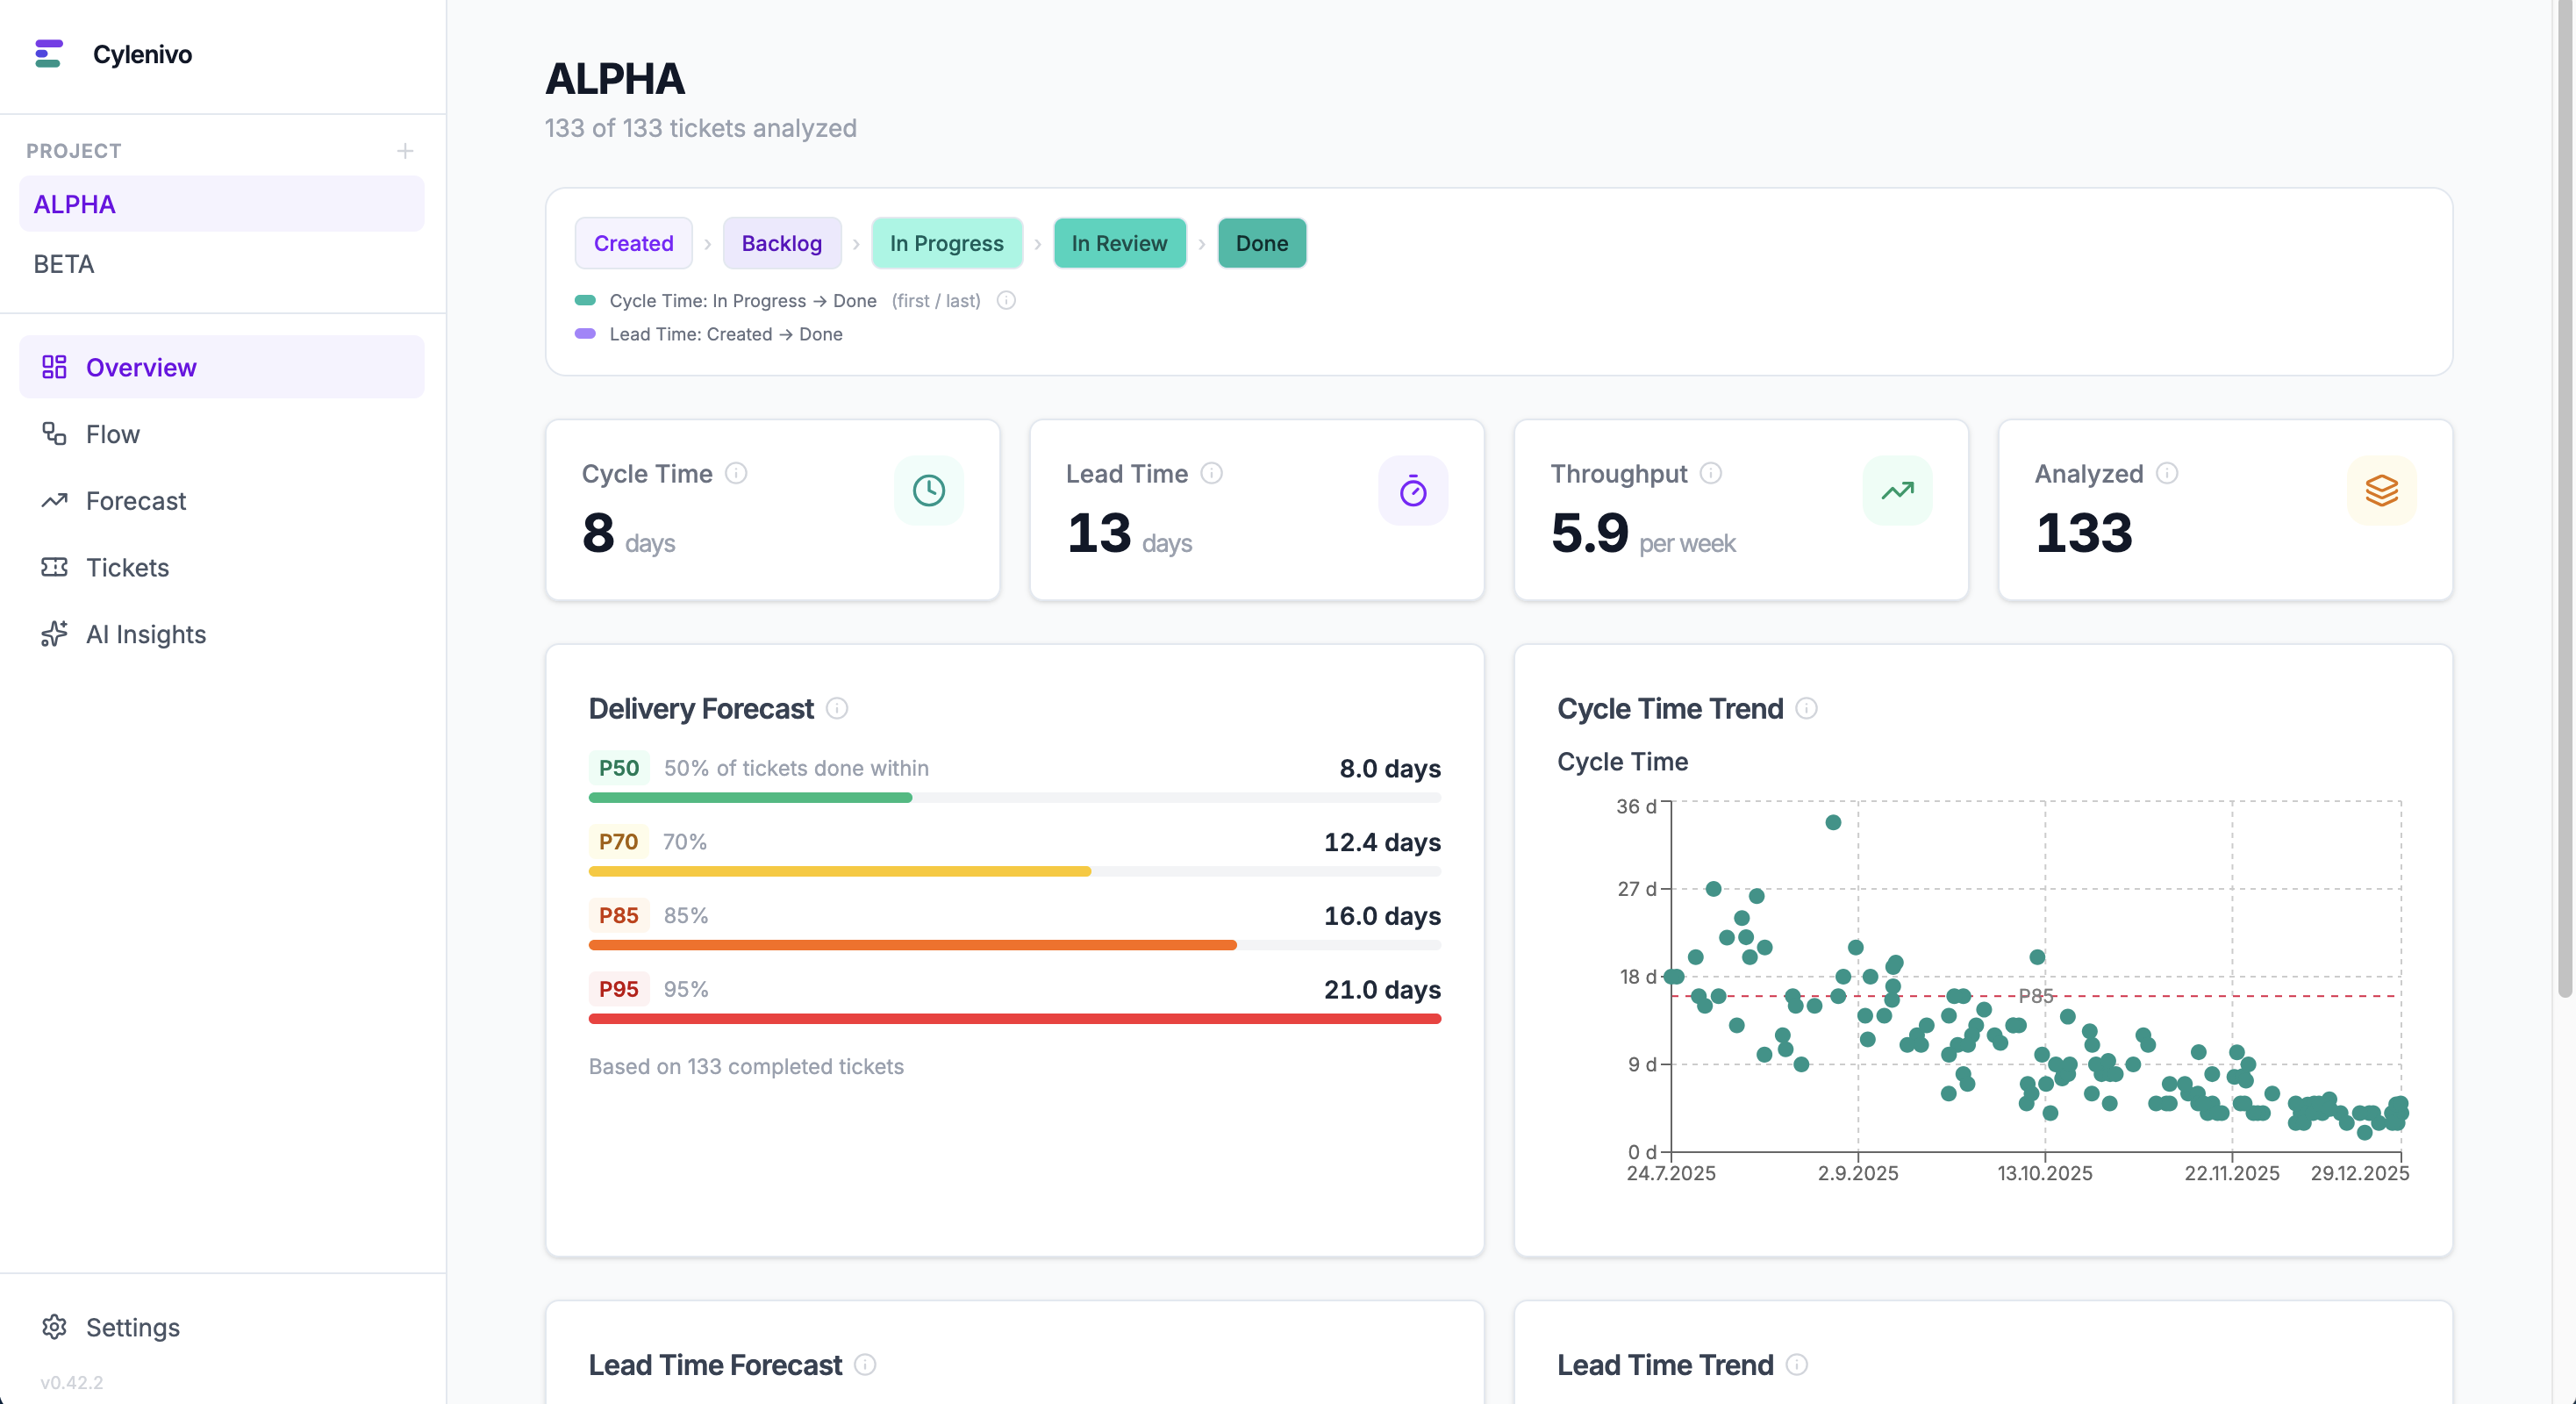
From that data you get the things Jira won't show you: P50, P70, P85, and P95 percentiles so you know what normal looks like and what outliers look like; a scatterplot to spot tickets that took much longer than the rest; trend charts over weeks or months; and rework detection — tickets that looped back from "Done" to "In Progress" because something was missed.
It's the same raw data you'd export and analyze by hand in a spreadsheet. Cylenivo just skips the tedious part.
Download Cylenivo, connect to your Jira instance, and see your team's real cycle time in under 5 minutes.
Cycle time data tells you what's happening. These explain why.
Cycle time is only half the picture. Learn how lead time completes it — and why the difference matters.
Read the guide →Little's Law, Kingman's formula, and why WIP limits aren't optional — an interactive guide.
Explore Flow Physics →The Work-Feedback Loop — a framework for turning metrics into actual change, not just reports.
Read about the WFL →